Analysis of official documentation, with no testing on a paid account.
Shopify: understand the new session metrics
Literature review · Accessible sources and methodology
A session curve that picks up isn't always a shop that loses customers. Shopify changed its method of measurement between 21 and 23 September 2026. Before cutting a campaign or celebrating a better conversion rate, check what your dashboard compares.
The announced change, and its limitation
The changelog from 21 September indicates that sessions and indicators that depend on them may vary after this update. Shopify states that the number of orders, sales and accounts receivable are not affected by this change in measurement. This is an important distinction: a difference in a report does not alone demonstrate a change in your activity.
The deployment documentation describes three changes: filtering identified bots by default, counting some journeys without a conventional page view, and maintaining sessions past midnight UTC. A session ends after thirty minutes of inactivity. The total may therefore rise or fall depending on the traffic mix.
This change concerns Shopify Analytics. It does not mean that other measurement tools automatically adopt the same definition. Official sources consulted do not announce any tariff surcharges or exclusions specific to the France. However, the presence of certain filters depends on the report and implementation of the shop, especially in headless.
A rate can increase without additional order
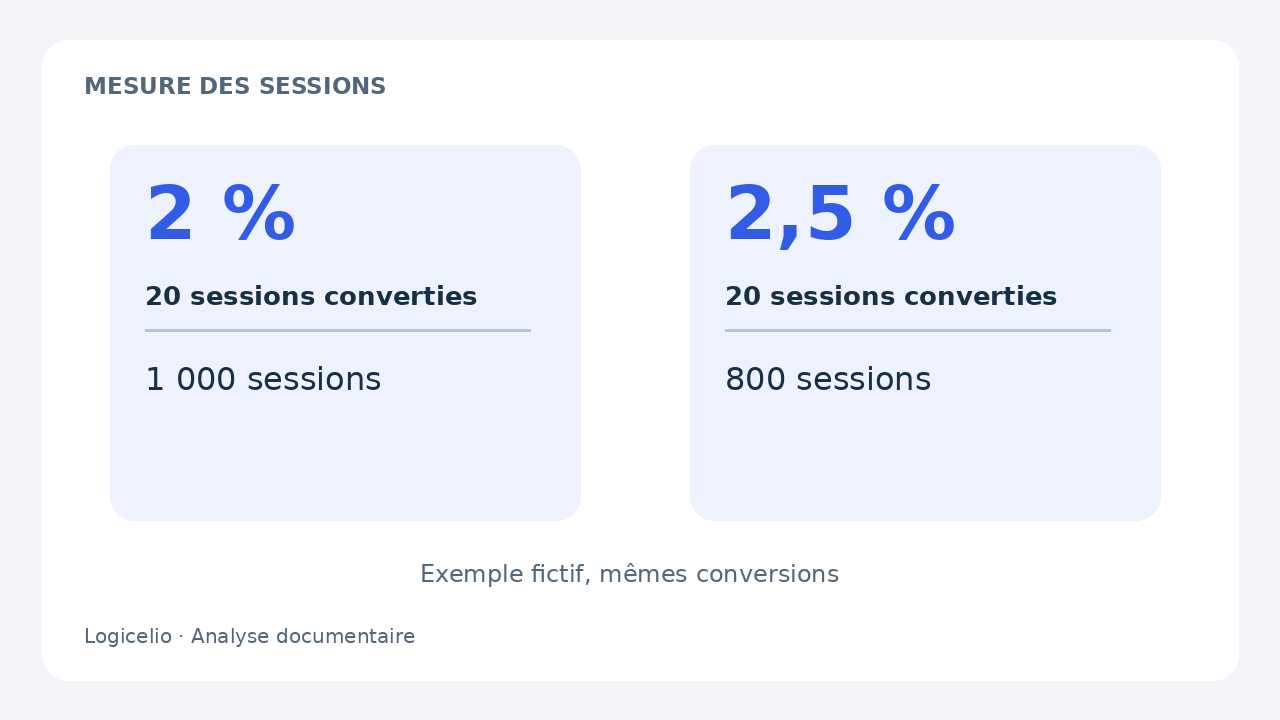
Let's take a pedagogical example, without data from a real shop: twenty sessions that resulted in a purchase over a thousand sessions give 2 %. If the denominator changes to eight hundred sessions, with the same twenty sessions converted, the result becomes 2,5 %. The difference is 0,5 point, a relative increase of 25 %. There is no additional converted session in this example.
| Indicator | Situation A | Situation B |
|---|---|---|
| Selected sessions | 1 000 | 800 |
| Converted sessions | 20 | 20 |
| Rate calculated | 2 % | 2,5 % |
This simulation isolates the denominator. It does not predict the magnitude of the change in your shop and does not systematically assimilate an order to a converted session. Its interest is to show why a target set on a single rate can become misleading when its calculation method changes.
Reading to do before moving a budget
For a small team, the concrete risk is to make a business decision based on a measurement break. We propose to keep two readings: economic continuity, with sales and orders, and the new statistical reference, with sessions. These readings answer different questions and gain to remain visible in the same report.
- Annotate deployment. Add the 21 period to the 23 September to your internal tracking. If you have a specific date for your store, keep it with the name of the report consulted.
- Describe the comparison. Note periods, spindle, filters and channels. An export without this information does not allow a colleague to reproduce your reading.
- Confronting the signals. A variation of sessions only requires a measurement check. A simultaneous decline in sales also deserves a commercial investigation: product availability, campaigns, purchase routes or seasonality.
- Review the objectives. Keep revenue targets, but document a new reference for session indicators. Do not apply a universal correction coefficient to all history.
Compare two periods remains possible, with reservations
Shopify indicates that historical data are not deleted or reprocessed by updating; however, their display may differ with robot filtering. An identical setting does not make pre and post sessions directly comparable. The robot classification concerns sessions from the 7 October 2025: an annual comparison that crosses this terminal requires an additional reserve.
If an agency is running your campaigns, ask for a note explaining the breakdown and the indicators retained. If an application resumes Shopify sessions, check with its vendor how it operates them. It would be premature to change platforms only to find a familiar curve: the immediate need is to understand the new repository.
What it changes in the choice of Shopify
This development reinforces the interest in asking, before choosing a tool, how an indicator is defined and exported. Find costs and limits in the Shopify review, differences in scope in Shopify or Sellfy, and other options in the e-commerce category.
Documentary analysis of Shopify ads, without access to a merchant's statistics and without claimed field test. Reading recommendations and simulation are proposed by Logicelio; product changes are attributed to Shopify.
Sources and transparency
Shopify, 21 announcement September 2026 ; Shopify, method and deployment of 21 to 23 September Sources consulted on 28 September 2026. Methodology · Trade transparency · Error reporting.
Editorial history
28 September 2026: initial publication. Dates are changed only after substantial changes in content.